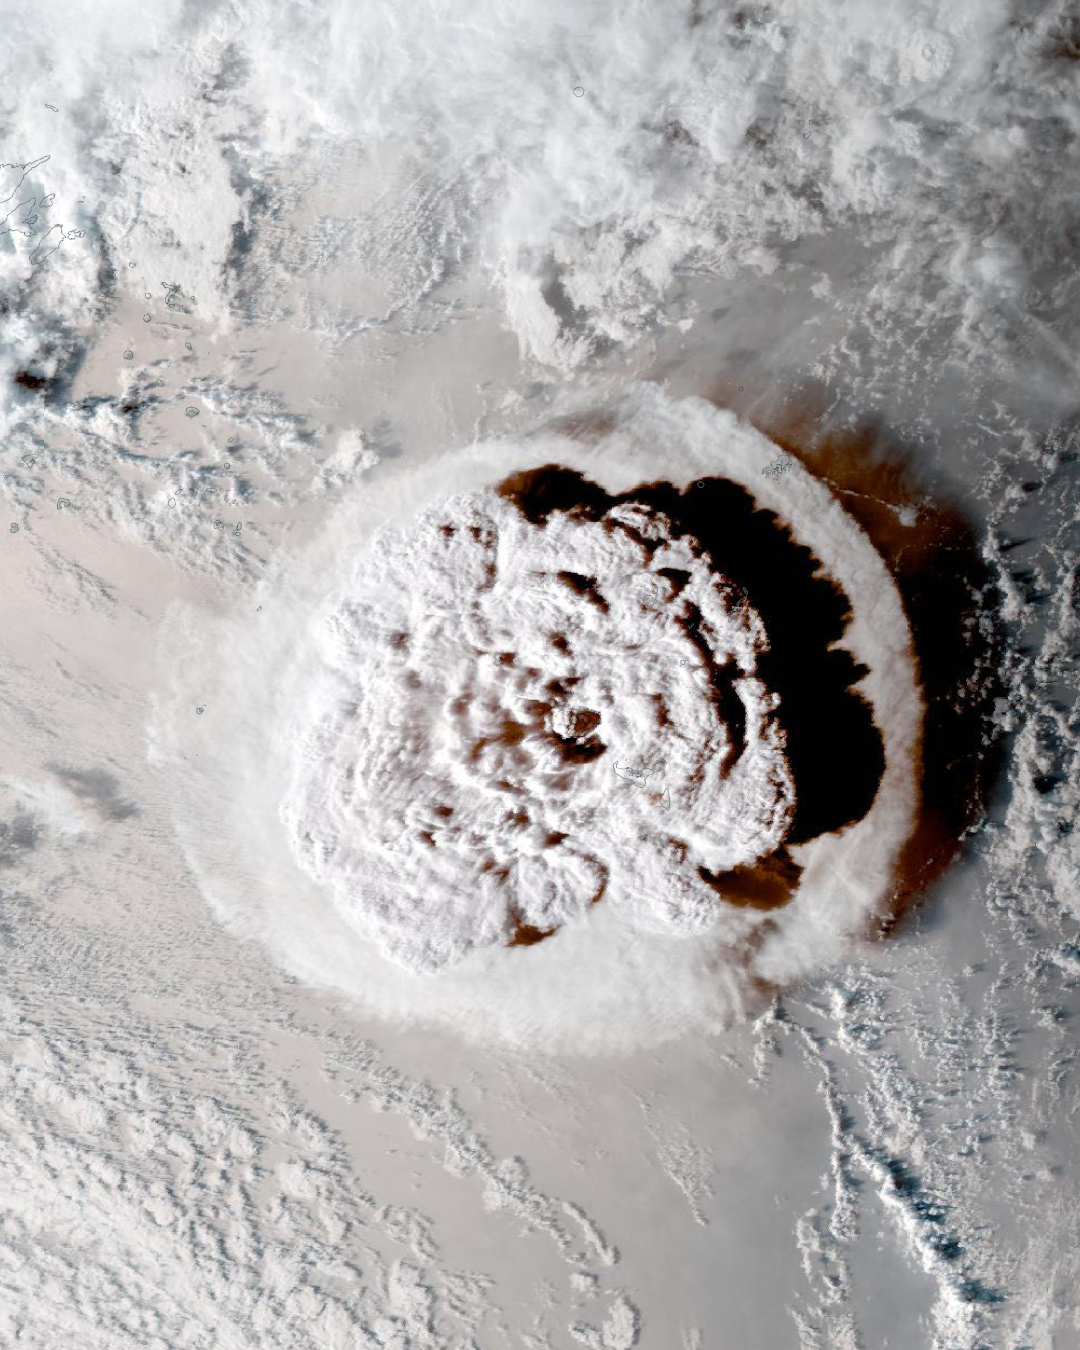
On January 15, underwater volcano ‘
Hunga-Tonga-Hunga-Ha'apai’ started erupting, sending ash, steam, and gas up to 20kms into the air. Satellites managed to capture this massive event.
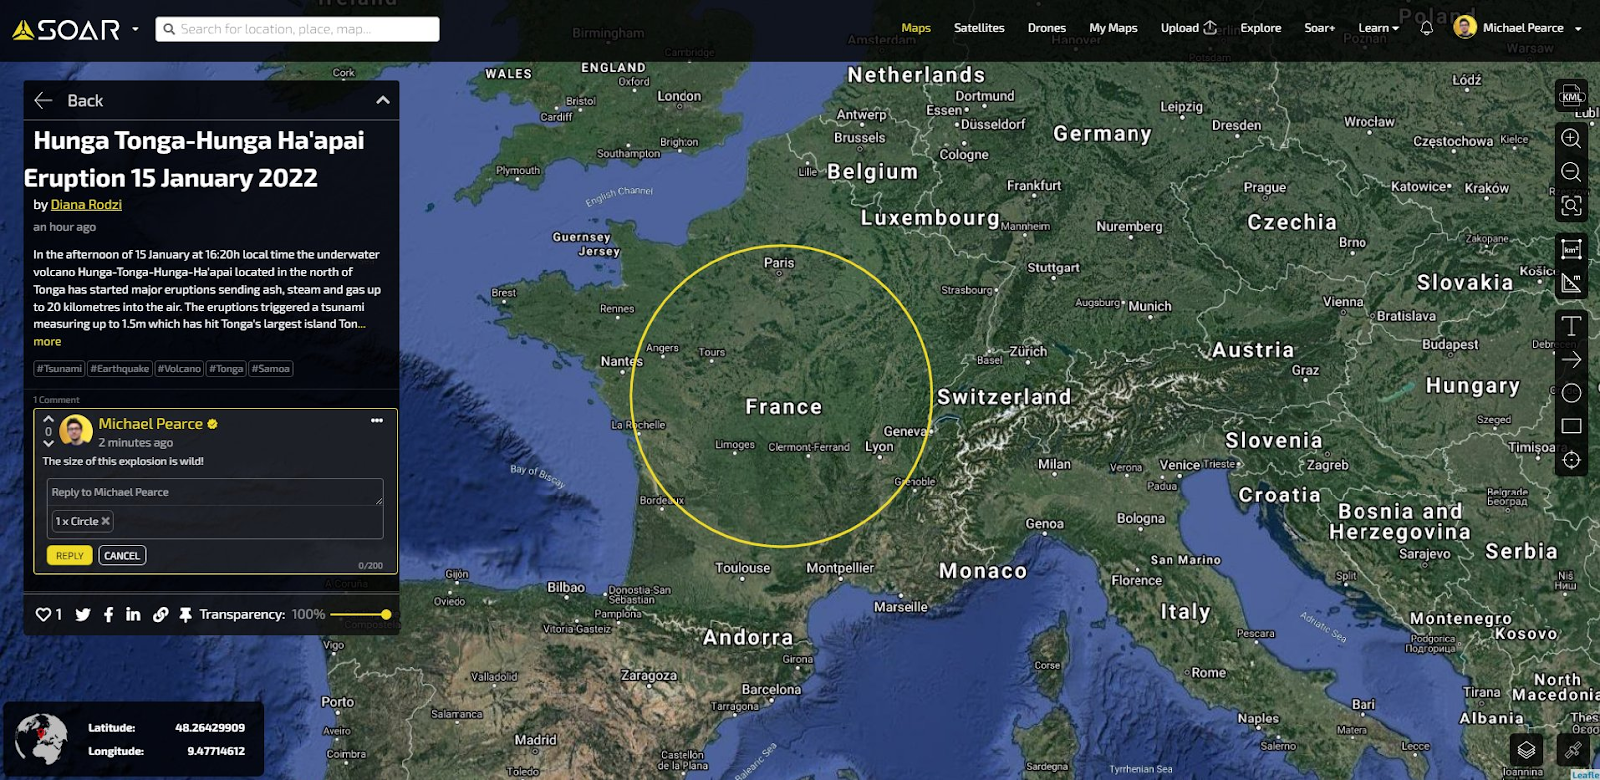
This devastating eruption is equivalent to 1,000 Hiroshima bombs. But the scale can now be fully understood using Soar tools to compare the exact explosion size to anywhere on the world map.
Users have begun comparing the size of the explosion to their local cities, using the annotation functionality of Soar.
For anyone wanting to see the comparison, they can simply open
the eruption map in Soar and use the circle tool to place a circular annotation over the Tonga explosion map, then drag it around the Earth to compare to any location.
The ability to compare the size to anywhere in the world puts into perspective how large this explosion was.
As the world recovers from this event, it’s fascinating to look back on this captured moment in history. You can see the disaster
in true colour and
in infrared in the Soar platform.
You can view, interact with, and comment on all of these maps, and more, on the
Soar platform.