

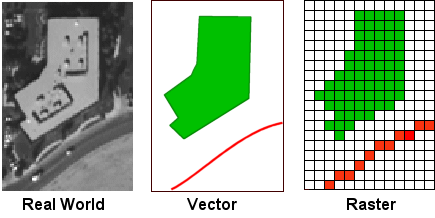
A representation of real world features versus vector and raster representation.
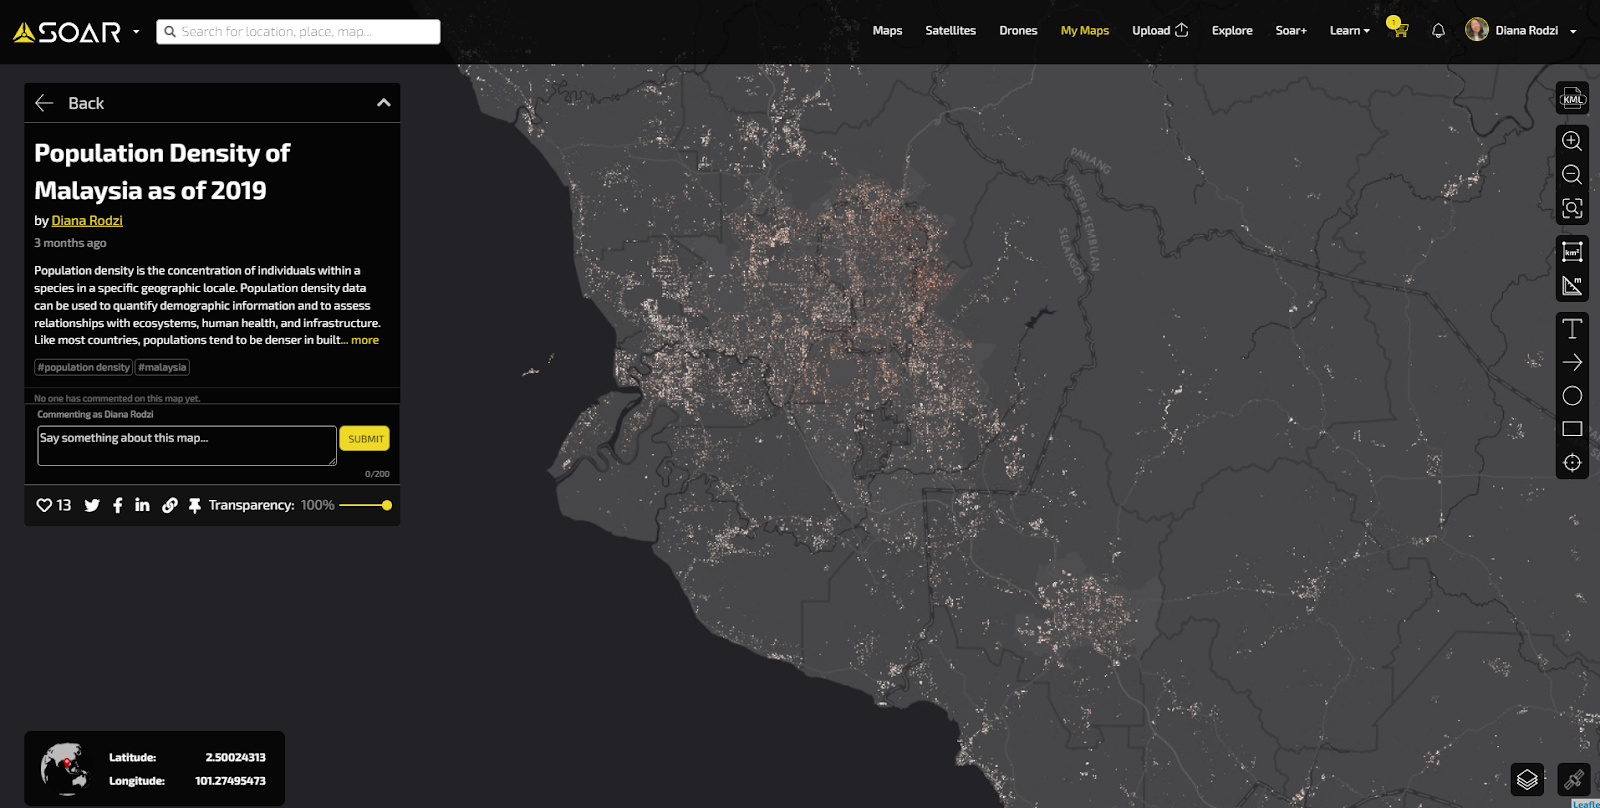
Population Density of Malaysia based on 2019 population statistics. View on Soar
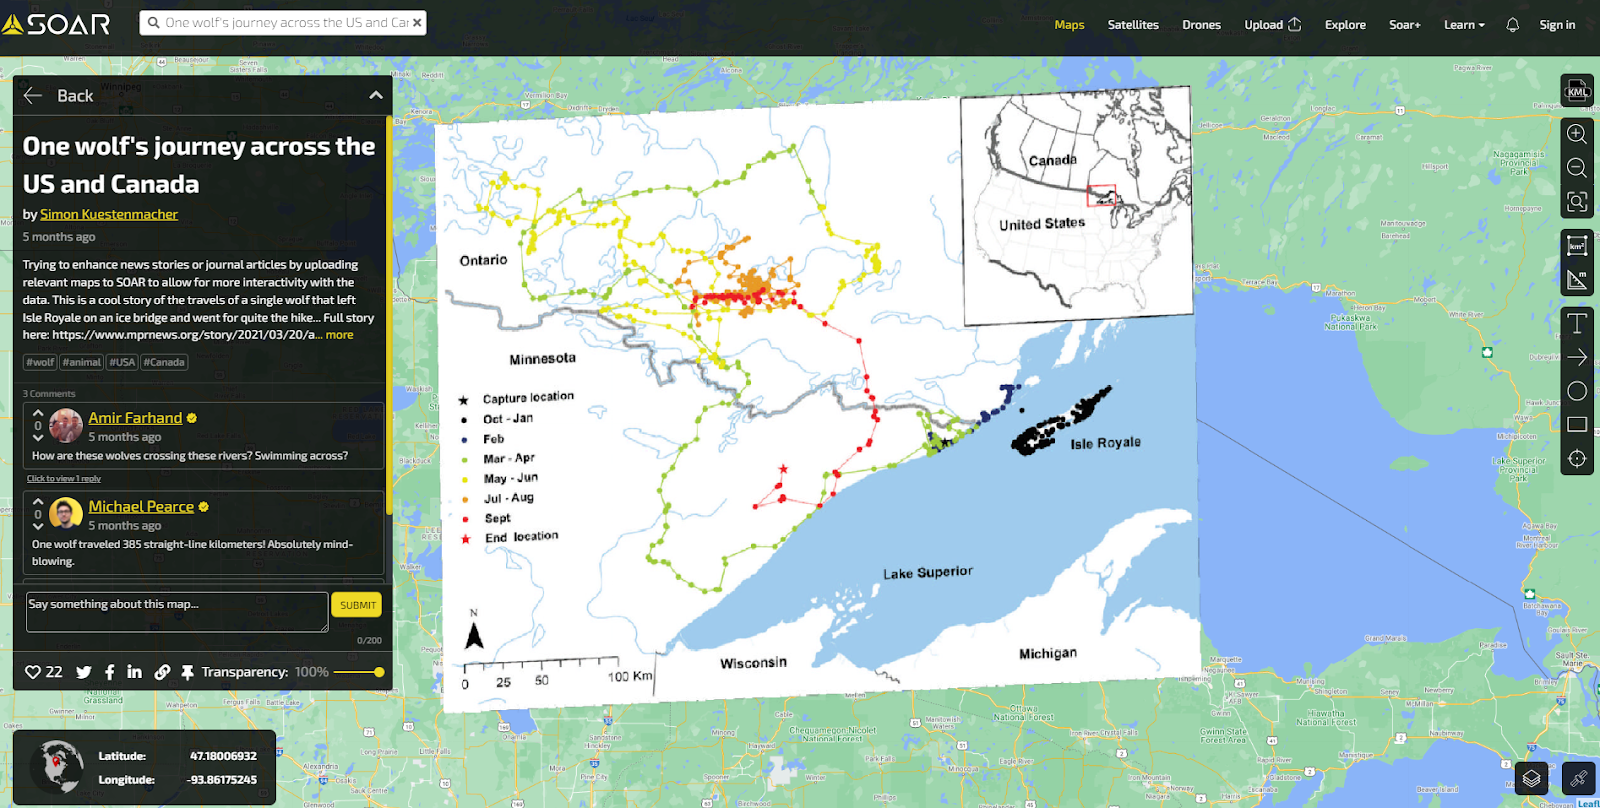
Animal movement maps such as this one from Soar provide important information for conservation scientists. View on Soar
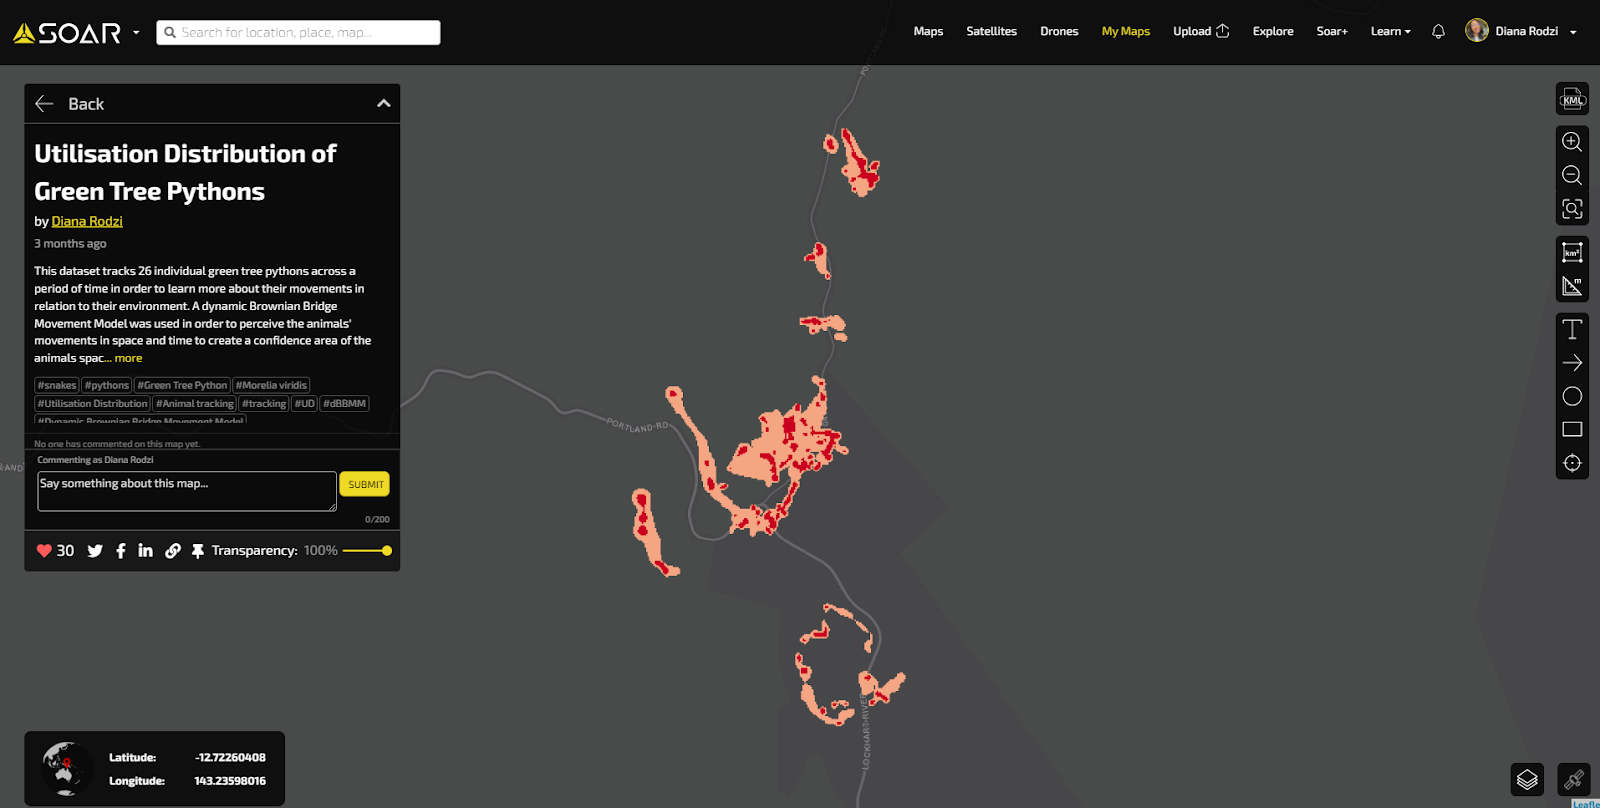
Visualisation of green tree python home ranges based on their movement. View on Soar