October 6, 2021

Sergio Volkmer is an architect and hobbyist-cartographer in Rio Grande Do Sul, the southernmost state of Brazil. A childhood love of nature and outdoor adventure drew him to geology. Before switching to architecture, Sergio discovered his passion for mapping as a geology major. He feeds that passion as an expert hobbyist in remote sensing on
Soar.
He started digital mapping for Open Street Map in 2013, mapping land coverage and he developed a necessary interest in satellite imagery and the free online utilities for processing the data. The first satellite image he ever downloaded and processed was a
Sentinel-2 image he used to map the forests of southern Brazil. He tells us he was “amazed” by the way the satellite image helped to distinguish between the vegetation of older woods and newer plantations of pine forests.
Sérgio Augusto Jardim Volkme
Sergio describes his training as a kind of community instruction, having been mentored and trained by “all the amazing people and organizations” in the communities where he works with OSM and Earth Observation. As a volunteer, he taught a course on digital mapping technology based in OSM to undergrads at a non-profit institution. Sharing maps and satellite that he finds beautiful or useful is another way Sergio feels he can give back to the community at large and continue to learn and share knowledge.
He started out sharing his maps on an OSM account. After mapping the extension of the Brumadinho Dam disaster, he ended up in objective and effective discussions on
Twitter, where he found many skilled and intelligent people from which to learn about EO and satellites, so he began to share his favorite images to his Twitter account. However, there is no georeferencing on Twitter, nor is there the option to directly compare images and maps, so he eventually transitioned to
Soar, a map and satellite image sharing platform with cloud storage, industry-specific features, and best of all, a plethora of high-res satellite images that can be used to improve analyses and mapping.
Sergio uses a variety of images for his digital mapping. He often has to use outdated default images provided by OSM but also uses Sentinel images when mapping more recent features. These tend to have a lower resolution. For detailing newer actualizations, Sergio has recently been using
SkyMap50 satellite images with
50cm/px resolution, which he says has been a great improvement. Areas like forests and lakes can usually be mapped with mid to low-res up to 10m, but it’s not ideal.
Sentinel’s S-2 bands 1-12 allow a much wider range of band combinations and the ability to highlight different features like wildfires, vegetation, water turbidity, algae, etc., but typically have lower resolution than visible light RGB+NIR satellites. The need for low or high-res depends on the objective. In general, high res is preferred and can be lowered later if needed. The sub-meter high-res is imperative for digital mapping of urban areas, human works, facilities, buildings, streets, different crops inside farms, etc.
How does satellite imagery improve agriculture?
Sergio: It helps provide fast measurement of informative areas, like of the health and growth of vegetation, indicating where it needs more or less fertilizers. Once a satellite parameter is established for each plantation, you no longer need to get ground samples every time.
How does satellite imagery tie in to ground level data?
Sergio: That’s one of the most important questions. Satellite data is most effective with confirmed ground tests. I see glacier and ice researchers doing it constantly. For agriculture grounds too, but it is easier to test all the corners of an agriculture field, while for glaciers, that’s not so easy, so it relies much more on satellite. Also, each new satellite has to be calibrated with ground data… and there is a lifetime of the satellite to be useful, so the use has some hurry to be tested, used, and effective.
The most fascinating thing about satellite imagery for Sergio is that we can simultaneously see the changes and constant patterns on the face of the Earth, its occupants, and its components. We can see the geologic time, like an accelerated time-lapse. We can see things we can’t appreciate at ground level, even when it’s right in front of us.
“I’ve realized how the large river, also considered a long lake, where I live…is differentiated from one side to the other and at the same time how it always behaves in those patterns of flow. There seems to always be some order in the chaos, philosophically speaking.” — Sergio
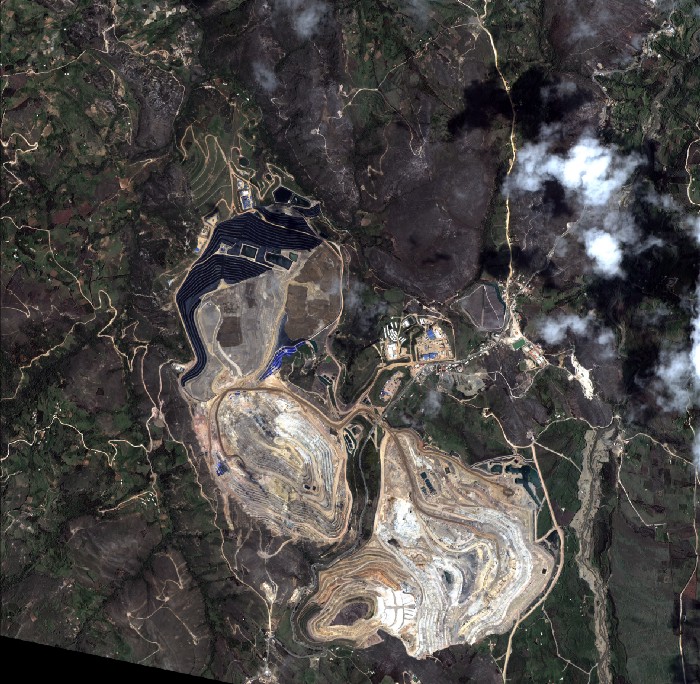
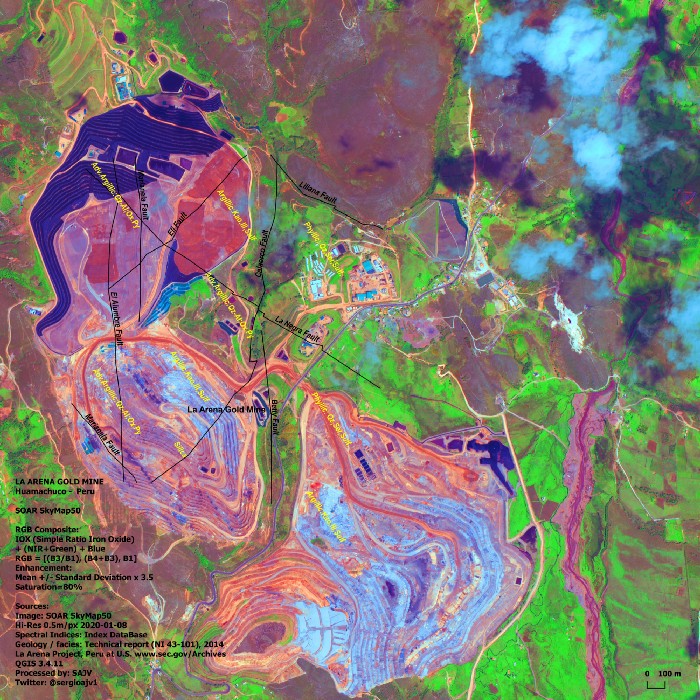
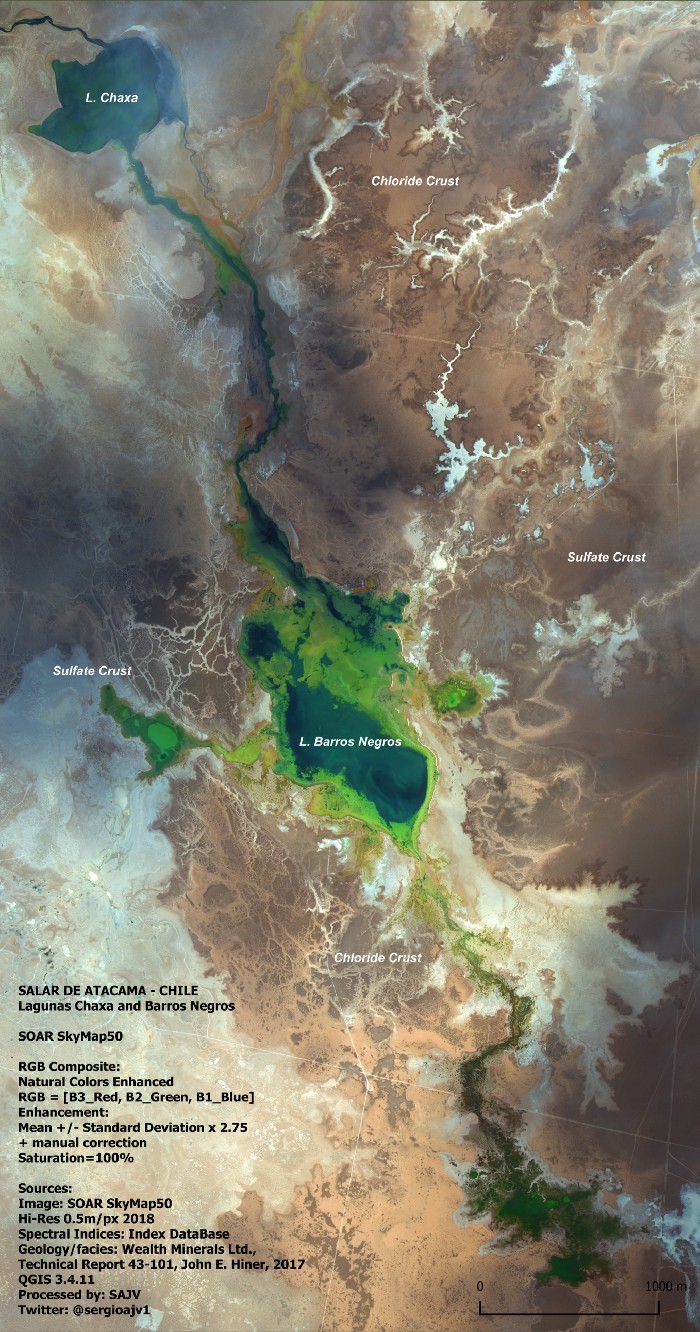
For high-res imaging that enables ground-level interpretations of mineralogy and environmental implications, Sergio uses
SkyMap50 50cm/px from Soar, the platform on which he now shares his maps and processed satellite images. This level of analysis was not previously available with older, low-res satellites. Sergio’s images can be found along with many other maps, satellite images, and drone images with convenient sharing, storage, and comparing options for professionals who can benefit from advanced and processed images from all over the world.